September 13, 2021 Updated November 1, 2023

In this guide, you will learn how to use candlestick patterns to make your investment decisions. Candlestick trading is a form of technical analysis that uses chart patterns, as opposed to fundamental analysis, which focuses on the financial health of assets. The illustrations and explanations will help you learn to evaluate essential candlestick patterns and make investment decisions about where prices may be heading next. Also, you’ll see how to evaluate a single day’s trading in light of trends in an individual investment and in the stock market or crypto market itself, as well as understand the psychology of buyers and sellers.
The firm's main research and development office is based in Tel Aviv Israel. It originally specialized in Forex and indices spreadbetting and CFDs but has recently expanded in stock trading also. At the time of writing, eToro has 2.2 out of 5 star on Trust pilot. The comments suggest that the platform offers some impressive features but withdrawing money can be difficult. Having said that, some of the negative reviews appear to be rants rather than constructive criticism. This can be examples of traders losing money through their own recklessness rather than eToro's fault. You should therefore take this reviews with a pinch of salt. OANDA is a global financial services company providing advanced currency solutions to both retail and corporate clients all over the world. In this article, we are going to review this broker’s trading options, tools, platforms, spreads, commissions, security measures, and educational resources to help traders make the right choice. AvaTrade offers a wide variety of trading solutions (spread trading, CFDs, and social trading), and peace of mind with its comprehensive regulation, covering the EU, Australia, Canada and South Africa. Clients can use a variety of platforms for discretionary and automated trading.![]() Best Award Winning Brokers
Best Award Winning Brokers Show Search Filters
76% of retail investor accounts lose money when trading CFDs with this provider.
76.6% of retail investor accounts lose money when trading CFDs with this provider. You should consider whether you understand how CFDs work and whether you can afford to take the high risk of losing
76% of retail investor accounts lose money when trading CFDs with this provider.
Candlestick trading uses candlestick charts to understand how your investment prices change. Learn when to buy and sell based on how the candlestick patterns look.
People use other types of charts, most notably line charts and OHLC charts (open, high, low, and close charts). However, candlesticks are unique for the clarity they offer.
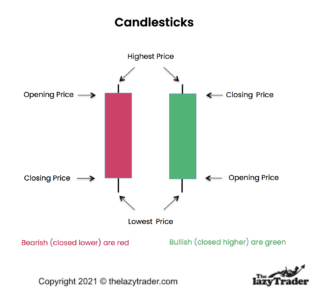
As you can see, the red bar indicates the price closed lower than it opened. A green bar means the price closed higher than it opened. The colors vary according to the charting platform, but red and green are fairly standard.
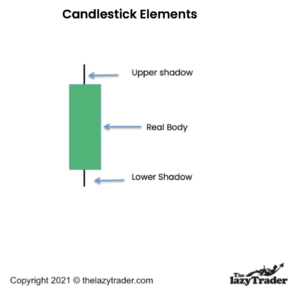
These three elements, the upper shadow, real body, lower shadow will show you how to evaluate any candlestick.
Looking at the picture, you can see how candlesticks got their name. They look like a candle with a wick. Sometimes the wick points downward, but they’re called candlesticks just the same, some with a short body or small body, and others with longer bodies – generally showing greater price volatility.
Various candlestick trading patterns can help you decide if it is time to buy or sell. We’ll be looking at the most common candlestick patterns and the trading strategies for each one.
It’s important to understand that when buyers dominate, the price goes up. When sellers take over, the price goes down.
Many traders do well with candlestick patterns.
For example, Larry Pesavento, a full-time trader since 1969, not only embraces technical trading but candlestick trading in particular. He teaches students how to use candlesticks to identify repeating patterns.
Another such trader is Steve Nison, who speaks and teaches about technical analysis, and has used it for more than 30 years. He wrote Japanese Candlestick Charting Techniques and is credited with championing candlestick trading in Western countries.
In addition, the most famous candlestick trader is the man who invented them, Munehisa Homma. He was a Japanese rice trader who tracked price action and saw patterns developing. He published his work in The Fountain of Gold — The Three Monkey Record of Money in 1755. In today’s dollars, he made about $10 billion.
You’ll have to get used to this kind of trading if you’ve been buying and selling based on fundamentals.
However, there’s another way to anticipate prices. It’s called technical trading.
Technical traders make decisions based on how the chart looks. They watch for patterns–in this case, candlestick patterns– that indicate where the price may go next. If you’ve ever looked at a chart, there are confusing zig-zag lines that look really intimidating.
Candlesticks are an easy way to understand the price action. You can use candlesticks to decide when to buy, or when to take your profits and sell. No analysis is accurate 100% of the time. But many traders are quite adamant about using them.
There are 42 candlestick patterns. But don’t let that scare you. You can become quite good at candlestick trading by mastering some of the most important and frequently occurring ones.
Think of candlestick patterns in three categories and that will keep you focused.
Traders have given names to each kind of candlestick pattern. Here are four examples.
For now, just be aware that there are many. Some make more sense than others, probably because traders were having fun making them up. You’ll understand them better if you see the explanation as you go – but don’t worry about gravestone dojis, dragonfly dojis, bullish haramis and bearish haramis for now.
Some candlestick patterns involve three candlesticks or more, but a “pattern” can be a single candlestick. All of the patterns we discuss below are indicators by themselves, but it is important to zoom out and see where the pattern is in the overall chart. In particular, reversal patterns should occur after a long uptrend or downtrend.
A bullish candle pattern indicates the price may rise from where it is. Learn to watch for these as an indicator for when to buy or at least watch the price action to confirm the bullish direction.
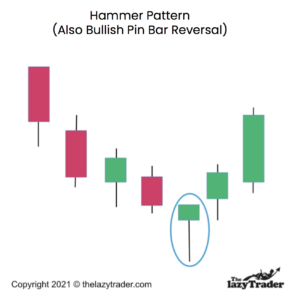
Let’s look at the hammer. You can see the handle extending below and the hammerhead at the top.
The hammer shows that the price dipped low (indicated by the long lower shadow) then bounced up to close above where it opened.
You might say, “Okay, I have a rough drawing of a hammer. So what?”
This formation means the prices traded down during the day. That’s why there’s a long handle on the hammer. The price action moved lower and lower as more people sold.
Then buyers decided that it was low enough and they bought it, driving the price up so that it closed above where it opened.
You can see that buyer interest continued for the next two days. It looks like this could be a turning point.
Just in case you are wondering, there is no “nail” formation. Traders didn’t stick with construction terms when making up these names.
You could say this one is a bullish reversal pattern. It indicates the price may rise, reversing the direction.
You will sound really smart at gatherings if you say “bullish reversal pattern.” That’s a side benefit of knowing this stuff.
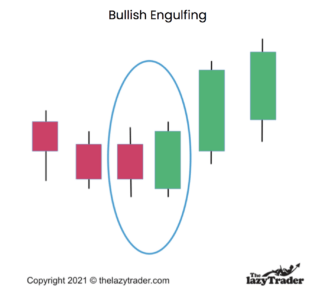
This pattern involves two candles. The first candlestick is a red one, and the second is green. A green one “engulfs” the red one because the body has a lower opening price and a higher closing price. This can indicate that it is going to rise. Note that no indicator works 100% of the time, so this is a possible indication, not a guaranteed one. Candlestick trading shows what is possible, not what is inevitable.
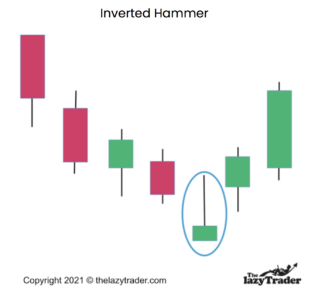
In the inverted hammer pattern, shown above, the hammerhead is at the bottom. The opening and closing prices are close together.
The handle of the hammer should be more than twice as long as the hammerhead. Though the price did not close at the top of the range, it still closed higher than it opened.
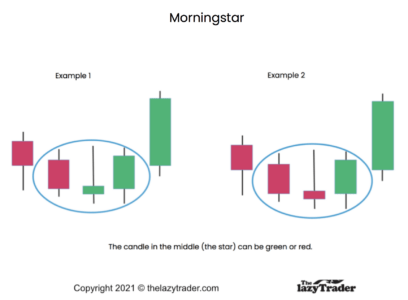
The morning star pattern is a bearish reversal pattern. Though price dropped buyers pushed prices back up. Even the red morning star indicates the price bounced off its lows.
The Morningstar occurs in a downward trend that forms a series of three candlesticks.
You see that the first is a red candlestick with a long body.
The second is green or red but is squatty looking. The price action didn’t change as much that day.
Our third candlestick is green, meaning buyers jumped in and drove the price up.
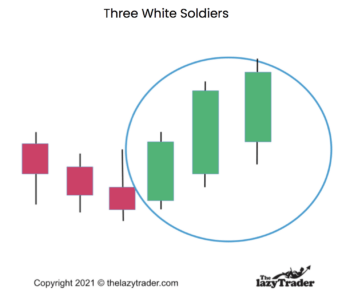
In the above pattern,“three” refers to three consecutive days of trading, resulting in three green candlesticks. On some charts, these candlesticks are white, hence the name.
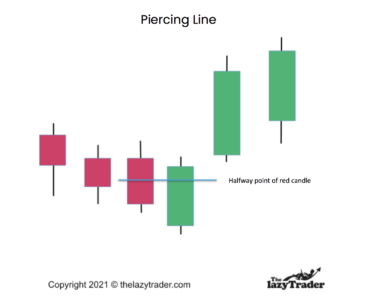
The piercing line pattern above is similar to the engulfing pattern, but the green candle sits lower in the formation.
Look for a gap down in the opening price with a close that is higher than the 50% line in the previous candle.
The chart doesn’t draw the midway mark for you, so you have to determine it for yourself.
These candlesticks indicate price action may trend lower.
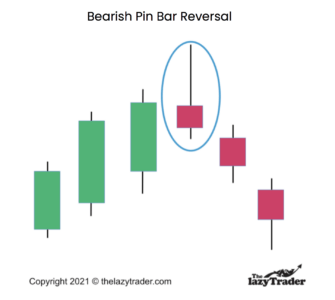
The bearish candle pin bar reversal pattern shown here occurs at the top of an upward trend. This can candlestick signal reflects the uptrend is over and people are starting to sell.
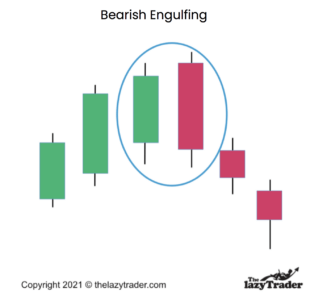
In the Bearish Engulfing pattern shown here, the bearish (red) candle has a long body that reaches both higher and lower than the preceding green candlestick..
Sound familiar? Earlier, we looked at a bullish engulfing pattern. Watch those colors. Bearish is red; bullish is green.
This is a reversal pattern you will see at the top of a trend. The body is longer than the green candle from the day before. This can be an early sign of dropping prices.
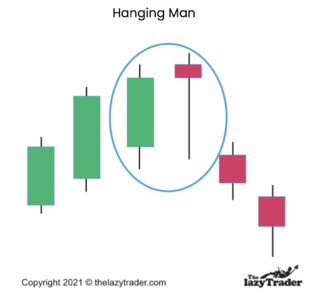
This is a pretty reliable bearish formation in candlestick trading. Yes, it looks like a hammer, but it is red, and it occurs at the top of an uptrend.
In the Hanging Man formation, the long handle shows you that there was a good-sized selloff. Sellers could take over and drive the price down, creating a new downward trend.
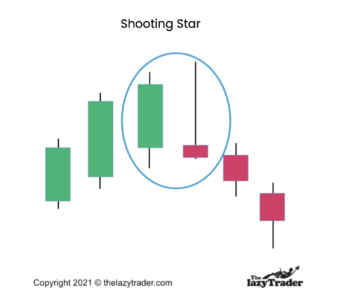
The Shooting Star looks like an inverted hammer but forms at the top of an uptrend. Buyers drove the price up, but sellers took over. Look out below. This one could tumble for a bit.
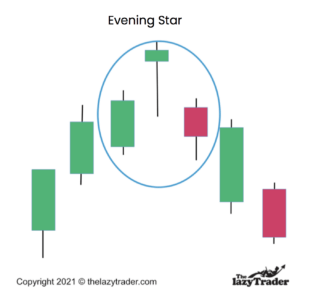
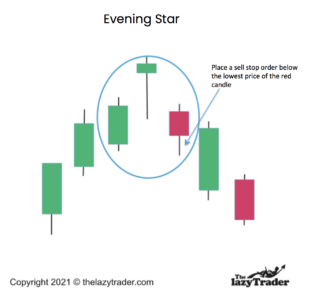
You need three candlesticks to see this Evening Star pattern: a green candle with a long body, a short green candle, and a red candlestick.
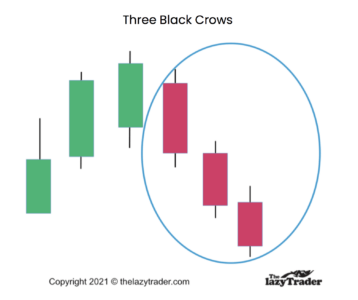
Three Black Crows has three bearish candlesticks that close near the lows of each day.
It looks like people may be bailing out, especially because it occurs after an uptrend.
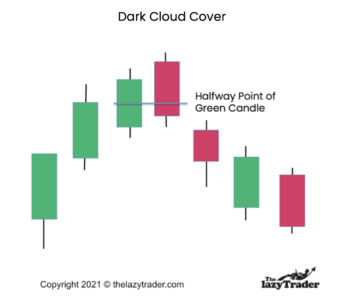
In the Dark Cloud Cover pattern, the price gaps higher and then sells off, creating a candlestick that shows a closing price lower than the midway point in the previous candle. It has taken back all of yesterday’s gains.
There’s a bit more you need to know before you start trading.
That means more than just knowing what they are; it means knowing what they mean. Practice reading candlesticks, including the setups that include previous candlesticks.
These are vital concepts that can add power to your trading. These two ideas are the foundation of technical trading.
Support indicates a level where the price action has bounced off a low previously. Resistance shows where prices have fallen from a recent high.
Here’s an example of each. Study Dow Theory to get a full understanding.
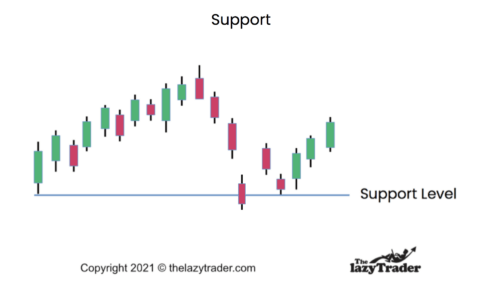
Support means the price bounces back up after reaching the same low as before (approximately).
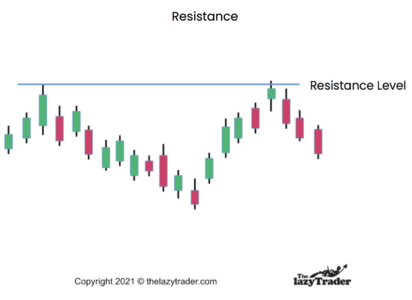
The first candle breaking through resistance can and does happen, but often after several attempts and fallbacks. Look for confirmed continuation patterns with a second candle confirming the pattern.
Look for reversal candlestick patterns at support and resistance.
Again from Dow Theory, trends tell you where price movement may be headed. The saying goes, “The trend is your friend.”
A trend will continue until a reversal signal. Candlestick trading relies on trend reversals quite a bit, so understanding trends, both in the short-term and long-term, is vital.
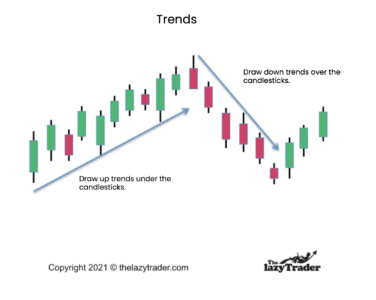
A trend, as shown here, is the result of prices generally moving in one sloping direction.
The longer the trend, the more reliable it is.
Determine the risk/reward ratio.
Successful traders evaluate the potential profit vs. the potential loss for each trade. Yes, it is a guess. But you can find forecasts from experts.
Example: if you estimate you could make $2000 in profit, but could lose $1000., your risk is 10:20. This translates into a 1:2 ratio. That’s a reasonable ratio. The more you stand to win, the more you stand to lose. Study risk/reward ratios to determine your risk tolerance.
Limit investments to 1%-2% of your cash.
This limits your losses. Some winners may make up for the losers.
Buy positive reward investments.
These offer the possibility of more profit than loss.
Use stop-loss orders
A stop-loss order automatically sells your position if the price drops to a level you indicate. This type of order is available on all forex trading platforms. You can set this order for the lowest price of the candlestick, such as the hammer, inverted hammer, etc.
A trailing stop loss order is a percentage. If the price drops 15% to 20% (your choice), you will automatically sell. Replace your initial stop loss order with a trailing stop loss order after your position has gone up in price. If you set the price too tight, like at 2%, you are likely to get “stopped out,” meaning it will sell not because it is in danger of dropping too far, but merely because of daily fluctuations in the price action.
Be aware that a market order is one where you will accept the best available price. It has no limits.
Create a trade exit strategy
This means that you will do some consolidation and take your profits.
What are the pros and cons of candlestick pattern trading vs. fundamental trading?
Candlesticks make trading more objective because you can see what the price action is telling you, as opposed to guessing how the company will do in the near future.
The Cons
Let’s look at trading strategies for each pattern.
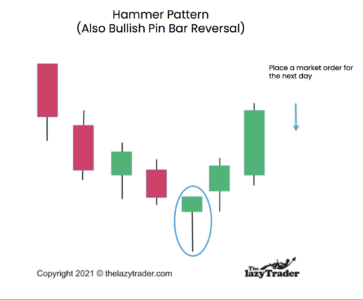
This hammer pattern, as we see here, can be the beginning of a series of green candles.
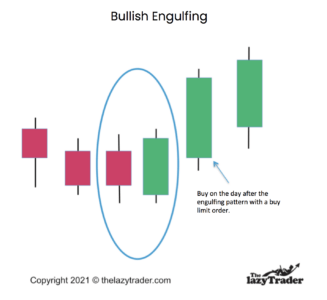
This Bullish Engulfing pattern is quite well-known, so expect savvy traders to jump in and run the price up.
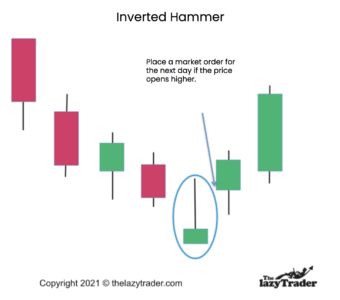
The inverted hammer suggests a price reversal in progress.
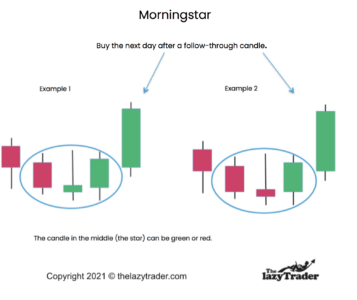
In this pattern, wait for confirmation the day after the “star” forms. In other words, wait to see if it is followed by a green candle.
Take Profits: When you see a reversal candlestick pattern that indicates a drop in price, or when it has risen 20% to 25%, whichever comes first.
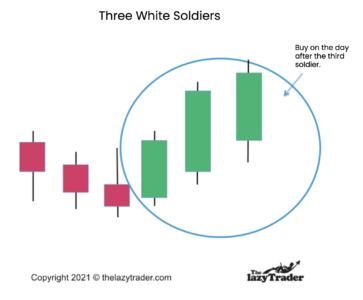
The steady rise in price in this pattern is a strong indication of higher prices to come.
Strategy Note: This is a strong pattern, but only if all three green candlesticks form. Wait until you see all three before you buy.
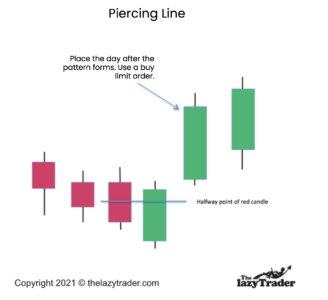
This piercing line formation is one traders watch for, so be prepared to see buyers coming in.
We will be looking at when to get out of a falling position. Use a sell stop order, which sells at the next available price after a price you designate.
You see here that prices rose but sellers stepped in, causing the price to close lower than it opened.
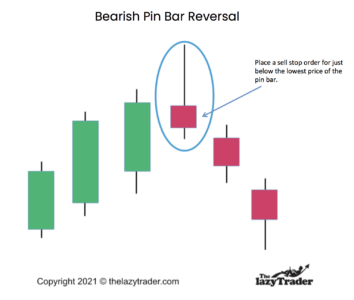
Strategy: Place a sell stop order just below the low price of the pin bar’s lowest trade.
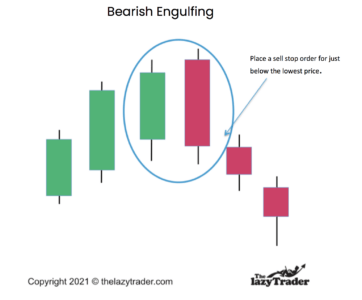
This bearish engulfing candle is a very common indication that prices will fall.
Strategy: This is a strong and reliable pattern. Place a sell stop order for the next day.
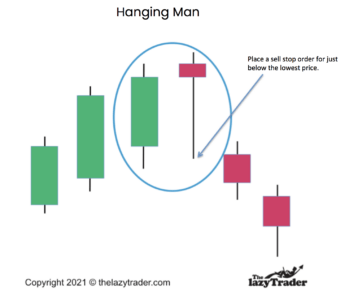
You see in this Hanging man pattern that the high price did not hold, indicating sellers took over and will continue to dominate.
Strategy: Place a sell stop order at the closing price of the Hanging Man pattern.
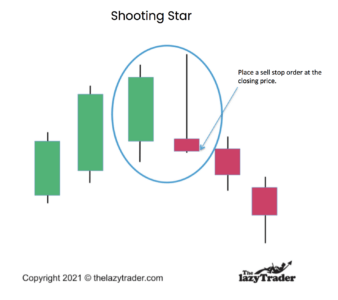
Here, in the Shooting Star formation, it is obvious that sellers drove the price down and may continue to do so.
Strategy: Place a sell stop order at the closing price. This one is pretty unambiguous. Only a hardcore optimist would buy into this pattern.
Though the price closed above the opening, it was not by much. This is not a strong showing for upward price action, and sellers could drive it down.
Strategy: you must wait until all three candles have formed. Sell on the fourth day.
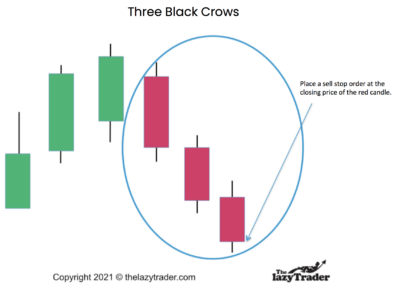
Prices dropping like this so steadily are a very strong indication that the upward trend is reversing.
Strategy: You would be hard-pressed to find a trader who would expect the price to go up after three devastating down days from the top of a trend. One method is to sell during the second candlestick formation, especially if you are taking profits. There’s little to gain by waiting for the third candle.
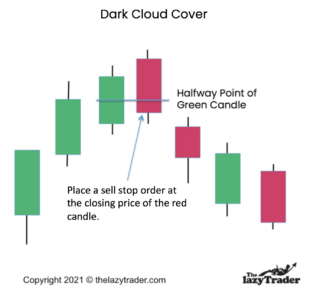
Here, in the Dark Cloud Cover pattern, we see that buyers gave out, and the price dropped low enough to be of concern.
Strategy: Place a sell stop order at the closing price of the red candle.
Social trading appeals to many investors, especially those who are trying to learn.
This platform allows traders to communicate like you do on Twitter and Facebook. You can share trading ideas and experiences with other traders. One useful feature is the ability to examine professionally managed portfolios.
Ava offers platforms for multiple experience levels. You can automate your trades and follow expert traders to learn from their insights.
This platform is not available in the U.S. Naga allows you to copy the best traders on the platform. You can trade stocks, cryptocurrencies, and Forex across the world.
This forex and CD broker makes it easy for traders to get started quickly. You can trade forex, stocks, commodities, metals, and cryptocurrencies.
FP uses the Autotrade tool. This allows traders to copy trade. It offers live statistics, along with risk-management systems. You can see the full trading history of the most successful traders and mimic their methods..
The platform allows a low minimum deposit. Those trading for the first time can get started here. Free demo available. Trade forex, commodities, indices, stock, and cryptocurrencies.
To sum up, candlestick trading is technical but simple, and that’s why they are popular among those who want to learn about market psychology and evaluate price action objectively. Remember that candlesticks are an indicator, not a sure thing. The market can surprise you.
Candlestick trading can be profitable if used correctly alongside other technical analysis tools and with proper risk management strategies. However, no single trading technique guarantees profits, as market conditions, individual skill, and discipline play crucial roles in determining trading success.
There is no single “best” candlestick pattern for trading, as different patterns provide various insights into market trends and potential reversals. The effectiveness of a candlestick pattern depends on the trader’s strategy, market context, and the combination of other technical analysis tools used.
To trade with candlesticks, study various candlestick patterns to understand their significance in predicting price movements and reversals. Combine candlestick analysis with other technical tools and indicators to develop a comprehensive trading strategy that incorporates risk management and proper entry/exit points.